Yesterday's action wasn't good since my position on Moncler entered in red territory, but I think that it's important not to focus on the day-to-day returns and pay more attention to the underlying behaviour of the stock instead. In light of this, yesterday's retracement doesn't invalidate my long bias both on Moncler and on the FTSE Mib. The retracement on the stock was on average volume (and lower than the day before) and stopped in an area that's good for long entries. A test in this area would provide a long signal for those that are waiting on the side line. The action on the index was also good, since the retracement was on very low volume, providing a test in an area of resistance. If today's action will validate it, the long bias in the market would definetly be validated. Here's the complete technical analysis on the FTSE Mib.
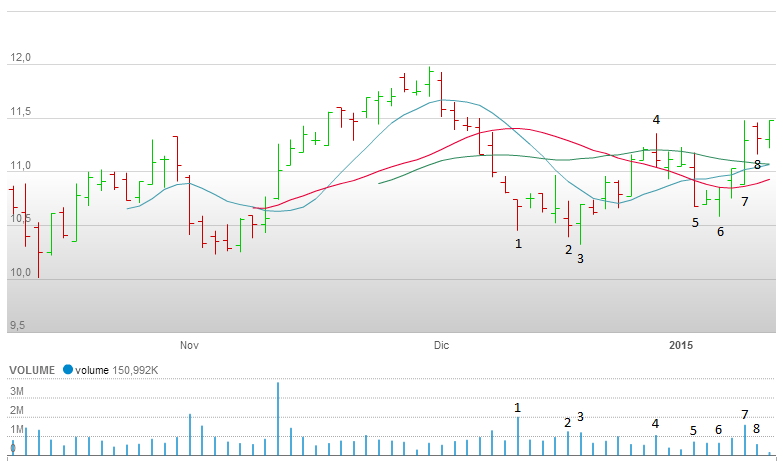 Today I bought Moncler (MONC.MI) during the morning at €11.48. Yesterday's candle was a test and I bought the stock anticipating a confirmation (for the test to be confirmed, today's candle should close higher). A safer trade would have been waiting for today's close that, if higher than yesterday, would confirm the test bar. You can find the technical analysis of Moncler here. Today will also be important for the FTSE Mib since yesterday's candle was a test of supply, if today the market will close higher on higher volume this would be a sign of strenght and possible higher prices. You can find the technical analysis of FTSE Mib here.
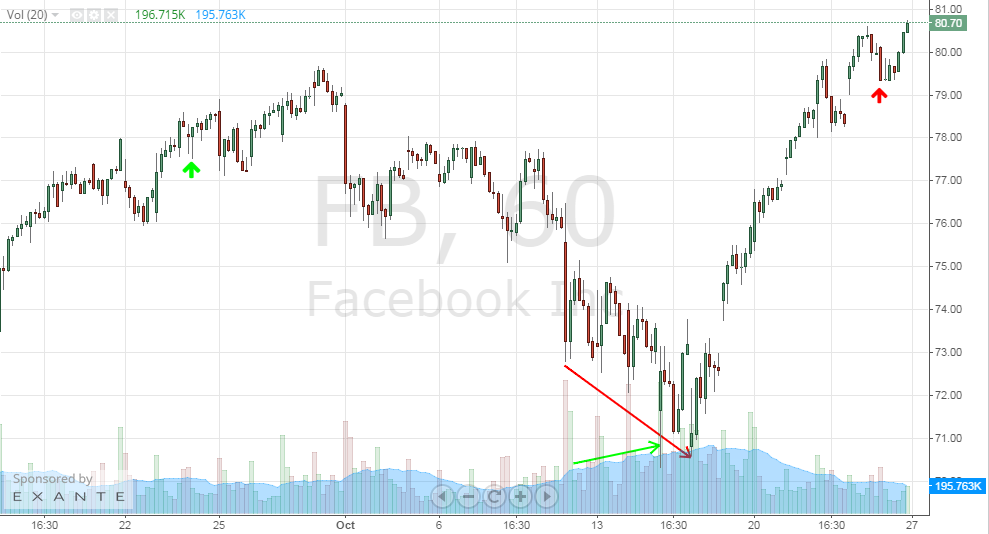 It ended up with a gain, but I'm not satisfied of my Facebook (FB) trade. I entered on 09/24 @ $78.26 and exited on 10/23 @ $79.95. I think that, instead of a 2% gain, it would have been better closing the trade at a loss. The fact is that, as reported in my previous post, this was a breakout play, but the breakout didn't play out well. Price chopped on highs after my entry point and retraced shortly before. Closing after the price action occurred on 10/01 would have been the right thing to do. At the time, price action on major indexes wasn't constructive and I think this contributed in dragging Facebook down. Having missed the ideal exit point, I held the position since I noticed increasing volume on lower prices. Especially the price action on 10/15 and 10/16 has been very constructive and major indexes were managing a rebound. I've been lucky, since the retracement has been strong enough to bring the stock to all time highs and I closed the position on 10/23 in anticipation of earnings. That said, I'm convinced that closing the position at a loss would have been the right thing to do.
 EUR/USD fell more than 150 pips since my last post, invalidating my long entry. Although the play didn't work out and the pair signed new lows, the scenario isn't changed that much. EUR/USD is oversold and it's near a support zone. I will wait for additional confirmation signals. There are also other currencies near support against the U.S. Dollar:    With many pairs near support zones, the U.S. Dollar Index could find resistance in its uptrend, which has been very steep. The index is also near previous high:  A retracement of the U.S. Dollar from recent highs would favour commodities and commodities-related names, which sold-off sharply during recent weakness on major indexes. Proximity of support zone and some strength on commodities could favour especially NZD and AUD, which are the most beaten down currencies this month losing -7% and -6.5%. I bought Facebook (FB) shares last Wednesday, with an entry price of $78.26. I was looking for an entry long on the stock since time and I liked its behaviour during recent weakness on indexes. The price indeed held up very well near its all time highs, touched the 50 days SMA and was above the 10,30 and 50 days SMAs that were all pointing up. I thought it was a good time for a breakout play, anticipating that a rebound on major indexes would provide the volume necessary for a strong up-move. I didn't wait for the breakout and bought the stock near highs. After my entry the stock retraced, mimicking major indexes' behaviour, but on Friday finally averages rebounded as did Facebook. The price is currently again near its highs and there are good possibilities of a breakout. If new highs would be negated, I will re-evaluate my position.  DISCLOSURE: The author is long Facebook
 I think that, following today price action, EUR/USD finally signed a bottom in area 1.2870-1.2820. Tick volume increased substantially in area below 1.30. This came after a downtrend, so that's probably sign that buyers entered the market / market makers are closing shorts and building long positions.  Price signed a first bottom in area 1.2840, then retraced to 1.2920 (61.8 Fibonacci level). After little consolidation at that level, price resumed its downtrend catching stops below previous bottom (see the significant increase in volume at first rectangle). Price then re-tested that level (second rectangle), clearing stop placed below previous bottom and sucking in breakout traders with short orders (spring). Today price broke previous high on increasing volume, a first possible price mark-up and possible signal of end of the downtrend. If next retracement downward will be on low volume, it would provide confirmation of bullish bias.
From Tvtropes.org: "The Kansas City Shuffle is an old established name for a con game that depends on the mark believing (correctly) that the conman is trying to con him, but being incorrect about how it's going to be done." Friday was the big day for Alibaba (BABA), that was listed on NYSE and gained +38% on its first trading day. With all the attention captured by this IPO, few focused on behaviour of major indexes.     I consider Friday's action a potential signal of weakness in markets at this level. Dow Jones, S&P500, Nasdaq and NYSE all present similar patterns but with some difference. What they have in common is that volume has been huge. INDU, SPX and COMPQ all registered new intraday highs that were rejected. S&P500 and Nasdaq price level is also near previous top and a possible double top formation could develop. The most bearish action is on NYSE: a double top has been formed on the first days of September while a lower high could develop following Friday's candle.
Following my bullish article on SINA (SINA), I'm looking for a long entry on the stock but, for the moment, I will wait observing how markets react in next days. After yesterday’s market sell-off, I’ll do a quick recap of stocks signalled here since blog’s start, before taking a two weeks' vacation.  NPD – The signal was the break-out of 2.5 so the entry hasn't been triggered. Yesterday the stock sold off but there was somewhat of a reaction from the lows of 2.22 which is positive although I wouldn’t touch it for the moment.  L – After reaching exactly 44.5, the point signalled as entry if broken, the stock sold off violently, so this name exits from the watchlist.  GNTX – This stock yesterday held up very well, opening at 28.74 but closing higher at 28.9 on very high volume (although the price was down -0.52% for the day). This is a constructive behaviour and, if market manages a rebound, this name could follow. A safe play on it would be waiting for an up-day on high volume breaking the 10,30 and 50 days SMAs.  SCHW – The stock rose, after triggering the entry point at 28, to a high of 28.65 but yesterday it followed the market giving back all the gains and closing at 27.75, near its 10 days SMA. The up-trend is still intact and 27.75 was a short term resistance and could act now as support.  BSX – Boston Scientific didn’t break 13.35 and it’s still ranging.  SOHU – Price broke the high signalled as pocket pivot at 58.24 but didn’t follow through. Volume on down days isn’t remarkable and the behaviour is still constructive. Maybe it needs more time to digest the earnings report.  CLNT – Cleantech Solutions is falling but on low volume and the resistance area of 5.2 is still below.  BORN – The same is valid for China New Borun, which lost -4.30% yesterday. The price is below the daily averages but it’s still inside the range.
As said, I will be on holiday for the next two weeks. I wish you all happy summer holidays! DISCLOSURE: The author has no positions in any stocks mentioned, and no plans to initiate any positions within the next 72 hours. 
Now that the SSEC finally is breaking out, we can look for interesting setup on Chinese stocks. 
BORN is consolidating after the huge breakout of October 2013 that ended the downtrend and the two minor breakouts of December 2013 and March 2014. Volume is drying up and price is close to the 10 and 30 weeks SMAs. The SMAs are all pointing up indicating that the uptrend is still there 
Pice is resting above the 10,30 and 50 days SMAs which are all very close. The last three days were down days on very low volume (less than half the average of last 20 days) possibly indicating that sellers are finished and the stock is ready to rise. This is a good low risk entry point on this stock with a possible exit strategy if the price would break down the daily averages on high volume or violate the support in area 2.6 
CLNT is another name which, after a breakout on huge volume on May 2013, is going through a long consolidation phase with tight weekly closes and low volume. The price is near the 10,30 and 50 weeks SMAs that are all very close to each other indicating a possible low risk entry on this stock. 
On the daily chart we can note how recently up-candles were supported by volume while last three days were down-days on very low volume. Yesterday’s candle was a doji which penetrated the 10,30 and 50 days SMAs but closed above them. Moreover, the 10 days SMA just crossed the 50 days SMA. At this price and these conditions a long entry on this name looks good with a re-evaluation if the price would fall on volume in area 5.2, a nice area of support. 
Yesterday SOHU reported Q2 2014 results and the price reacted strongly although results weren’t stellar (record revenues of $ 400mln but the company is operating at a loss). The weekly chart shows how the price is consolidating in area 55 – 60 since April, after a retracement from a double top in area 85 – 90. 
On the daily chart we can see how, following yesterday’s results, the stock opened lower but reacted strongly closing the day at highs of 57.5 on high volume and penetrating from below the 10,30 and 50 days SMAs (forming a pocket pivot point). Although it’s usually better waiting for a consolidation period after earnings announcements, a breakout of yesterday’s high would be a good entry point on this stock (breakout of pocket pivot) with area 53 – 55 acting as support and possible stop-loss zone.
DISCLOSURE: The author has no positions in any stocks mentioned, and no plans to initiate any positions within the next 72 hours. 
Yesterday BSX raised on high volume closing near day's high. The price is rising from the lows of the range in area 12.4 - 12.7. That area acted as support (note the many pin bars on high volume). We could be near the final breakout of the trading range because last time that price visited the support area there were few sellers (note the low volume in the last two down days). A possible entry point is the breakout of 13.35 on high volume. 
SCHW is forming a wedge pattern. The breakout of 27.9 - 28 on high volume would be a possible entry point since the same level was the high of July 16th, an up-day on strong volume that broke the 10 days SMA. 
Yesterday, before market open, GNTX reported Q2 2014 financial results. The price cleared previous local low in area 28.5 (probably triggering stop losses) but closed the day positive on high volume. This is a strong signal because price also broke the 10,30 and 50 days SMAs. Breakout of yesterday's high on volume would trigger a long signal.
DISCLOSURE: The author has no positions in any stocks mentioned, and no plans to initiate any positions within the next 72 hours. |
 RSS Feed