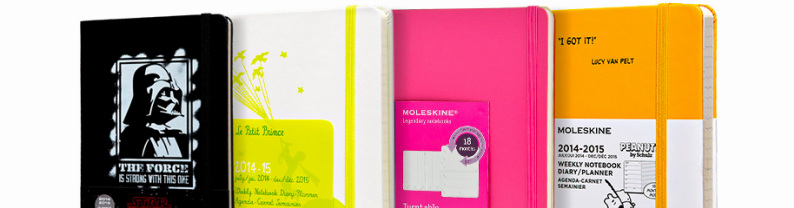
Moleskine S.p.A. is an Italian based company that sells the famous notebook used by artists and thinkers over the past two centuries: among them Vincent van Gogh, Pablo Picasso, Ernest Hemingway, and Bruce Chatwin, this last one gave to it the name “Moleskine”. The notebook was produced for over a century by a small French bookbinder that supplied the stationery shops of Paris, where the artistic and literary avant-gardes of the world browsed and bought them. In 1986 the small family-owned business went broke and was only in 1997 that a small Milanese publisher brought it back to life. The company now sells notebooks, diaries, journals, bags, writing instruments and reading accessories and it is also persecuting small non-core business initiatives like photo printing and digital products (like Moleskine Journal App for iOS).
Products are organized into 3 principal lines:
Paper collections: paper products like notebooks, diaries, home-office products and gifts.
Writing, travelling & reading collections: pens, pencils, bags, eyeglasses and reading lamps.
Digital products and services: template, smart-phone and tablet applications, smart notebooks by Evernote and print-on-demand services.
Products are sold in 105 countries worldwide through 4 main channels:
“Retail”, through DOS (Directly Operated Stores);
“Wholesale B2C”, products sold to intermediaries;
“B2B”, personalized products sold directly to customers;
“E-commerce”, through company’s website.
The company was listed in April 2013. During the IPO the two major stockholders, Appunti S.A.R.L. (84.8%) and Pentavest S.A.R.L. (15.2%), reduced their shares. Major investor is currently Appunti S.A.R.L. (42%) while Pentavest retains a much lower stake (7.6%). During the IPO, € 26.7 million of new equity capital was rised. Stocks were sold at € 2.3, in the middle of the offering range (€ 2 - € 2.65). The implied market capitalization was € 486.7 million, 15x EV/EBITDA 2012 and 25.3x P/E 2012.
Note on IPO: Sell side analysis pre-IPO utilized as peers premium & branded goods companies (like Prada, Burberry and Tod’s) and on-line retailers (Yoox and Asos) (see, for example, this report by Mediobanca, book runner of the IPO together with Goldman Sachs and UBS). Although I find it difficult to formulate a group of peers for Moleskine, I think that peers chosen aren’t real comparables because, albeit both Moleskine and its peers rely much on brand reputation and awareness, underlying products are too much different.
The company is currently expanding its business and changing the selling channel mix. Since second half 2012, Moleskine has opened 30 direct operated stores (8 are temporary): 9 in China, 12 in Italy, 2 in UK, 2 in France and 5 in US.
“Wholesale” channel accounted for 73% of sales in 2013 vs. 78.3% in 2012, “B2B” (17.7%) and “Ecommerce” (4.2%) share of revenues was roughly unchanged compared to previous year, “Retail” instead grew from 1.2% of sales in 2012 to 5% in 2013.
Another interesting growth opportunity lay in the B2B channel, which sells custom notebooks through partnerships with distributors and promotional agencies.
Sales through “Retail” channel have higher margins but with a different cost structure. Permanent shops and new personnel increase fixed costs and the operative leverage. Coupled with inventory management and related operational challenges, operating leverage is among the most important issues to keep an eye on in future financial reports.
NOTE: Moleskine S.p.A. prepares financial reports under IFRS.
Income Statement (Thousand of Euros)
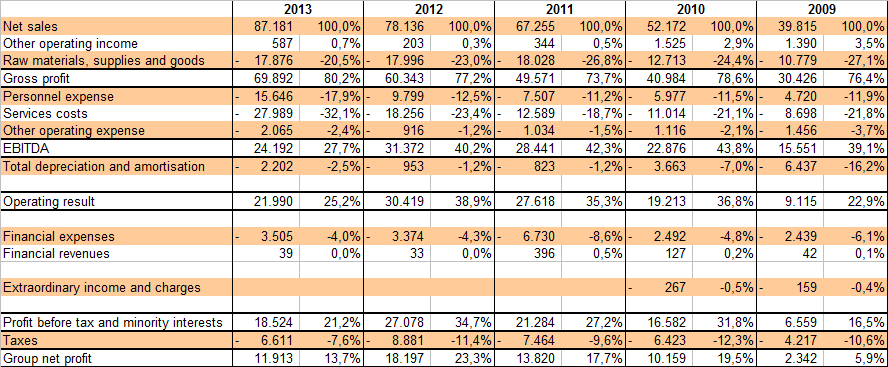
From 2009, sales grew 17% c.a. to € 87 million in 2013 although growth rate slowed down last year (12%). During the same period, gross
profit grew 18% c.a. to € 69.9 million (80% of sales) due to lower incidence of raw
materials, supplies and goods costs (-27% of sales in 2009 vs. -20.5% in 2013).
This is a result of better product mix and higher share of products sold on direct channels (retail and e-commerce) with higher margins.
Personnel expenses (-18% of sales in 2013 vs. -12.5% in 2012) and services costs (-32% vs. -23.4%) increased due to new direct sale points opening and related expenses, in particular rents, sale costs and administration costs. € 6.5 million of services costs are related to IPO (€ 4.2 million of floatation costs and €2.3 million of management incentives plan). Excluding these additional and non-recurrent costs, services would weigh on sales just 1% more compared to 2013.
Depreciation and amortization more than doubled in 2013 (€ 2.2 million vs. € 0.9 million). The increase is due to investments in fixed assets for € 7 million. New investments were evenly split among property, plant & equipment (direct sale points and main office expansion) and intangible assets (new e-commerce platform, internal systems for inventory and points of sale management, iOs and Android applications). Incidence of depreciation and amortization on sales rose to 2.5%. Financial expenses were slightly higher compared to 2012 but the impact on sales was lower (-4% in 2013 vs. -4.3%). This is due to a reducted leverage, probably a decision related to public listing (public companies have usually lower leverage than private ones).
Net profit in 2013 was € 11.9 million, -35% compared to 2012. Excluding € 6.5 million costs related to IPO, net income would have been € 16.2 million (net of taxes), -11% compared to previous year.
Balance Sheet (in thousand of euros)
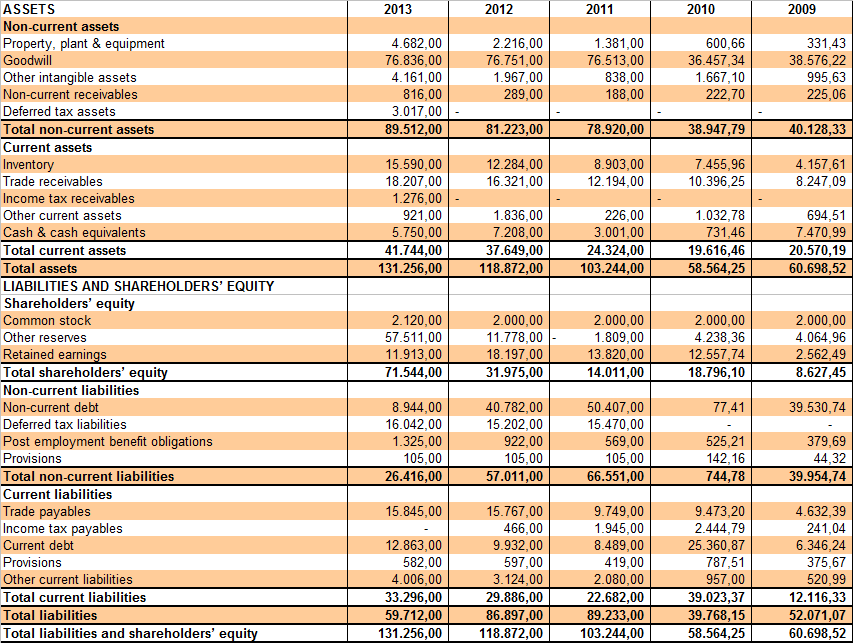
Total assets doubled to € 131.2 million in 2013 from € 60.7 million in 2009 and increased 10% last year. Inventory rose 30% c.a. during the same period, a growth rate (17% c.a.) higher than sales, although raw material, semi-finished and finished goods rose only 11.6% to € 16.4 million. The balance was effect of reduction in obsolescence provision for € 2.5 million. Inventory was 18% of sales in 2013 vs. 15.7% the previous year. A major change in inventory management started in 2013: the company since then directly buys raw material and sends it to manufacturers that give back the final product. Before 2013, acquisition of raw material was responsibility of manufacturers. The shift was undertaken in order to reduce costs (high block orders translate into higher discounts) and because management prefers direct control on input quality. Property, plant & equipment increased 70% c.a. since 2009 and more than doubled in 2013 over previous year. Last year there was a reduction in leverage, from 4.83 to 2.42 due to reduction of long term debt (from € 40.8 million in 2012 to € 9 million in 2013). Debt was 45% of liabilities as of 2013 year end, split 55% in current liabilities and 45% in non-current liabilities. Receivables (18% of sales in 2013) rose 62% in 2012 but didn’t change last year.
Liquidity Ratios
Liquidity Ratios
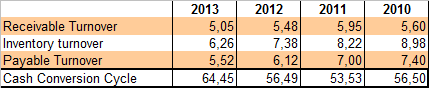
Receivables, payables and inventory turnover decreased in 2013 and cash conversion cycle rose from 56 days in 2012-2009 to 64 days in 2013. This probably a reflection of more sales through the retail channel and direct acquisition of raw material by the company.
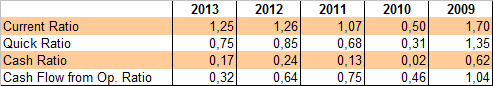
Liquidity ratios were constant except cash flow from operation ratio which was half its value the prior year (0.32 in 2013 vs. 0.64). Only current ratio was above 1 on 2013 year end.
Profitability Ratios
Profitability Ratios
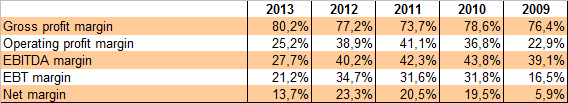
I think that monitoring the ratios above in future company’s financial reports will be important to have a hint on how the decision to focus more on direct operated stores is developing and what profitability ratios we can expect in the long term. The only ratio improved on a YoY basis is gross margin, due to reduction in incidence on sales of raw material, supplies and goods (-20.5% in 2013 vs. -23% the previous year). Excluding IPO costs, margins suffered especially due to increased personnel expenses (from -12.5% of sales in 2012 to -18% in 2012) and, to a less extent, increased operating expenses and depreciation & amortization, partially compensated by reduced incidence of financial expenses and taxes.
DuPont Analysis
DuPont Analysis
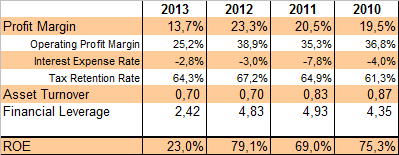
ROE decreased from a peak of 80% in 2012 to 35% in 2013. Last year, profit margin was 21%, 2% less than 2012. The cause is a decrease operating profit margin from 39% to 32.7%, less than compensated by higher tax retention rate and slightly lower interest expenses. Asset turnover was stuck to 0.7. Major impact on ROE was leverage reduction from 4.8 to 2.4. The 2013 number could be a reasonable value of the long term ROE achievable by the company. Main ROE drivers in the future would probably be operating profit margin, due to the focus on retail channel, and asset turnover, which can deteriorate due to increasing fixed assets.
Cash Flows (in thousand of euros)
Cash Flows (in thousand of euros)
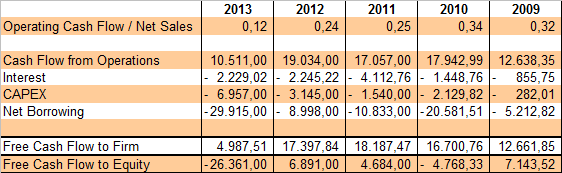
Cash flow from operations was € 10.5 million in
2013 vs. € 19 million the previous year. The decrease was due to lower net
income and increase in working capital for € 2.2 million.
Cash flow from investing activities was - € 7 million vs. - € 3 million in 2012.
Cash flow from financing activities was - € 4.8 million vs. - € 11.6 million the year before. Major drag of liquidity was the reimbursement of € 37.4 million in long-term debt partially compensated by the accession of € 8 million of new debt and € 27 million of equity capital raised during the IPO.
Total cash was reduced by € 1.3 million vs. an addiction of € 4.2 million in 2012.
Free cash flow to the firm in 2013 was € 5 million vs. € 17.4 million. The reduction is due to the decrease in cash flow from operations and the increase in capital expenditure for € 4 million. Free cash flow to equity was - € 26.3 million due to negative borrowing for € 30 million.
Financial Risk Ratios
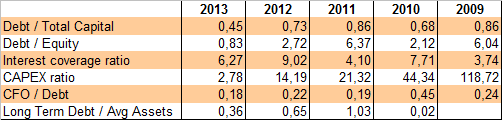
I’m not much concerned about financial risks
for Moleskine at the moment. The company raised additional equity capital during the
IPO, restructured debt and reduced leverage. As of 2013 year end,
debt/total capital was 0.45, debt/equity 0.83, interest coverage ratio 8.13 and
long term debt/average assets 0.36.
Q1 2014 update
There weren’t major developments in Q1 2014 results. Top line grew nearly 6% on a YoY basis while other metrics were substantially unchanged Cash flow was negative for € 4 million due to debt repayment for the same amount.
Q2 2014 update
Net sales for the quarter increased to € 23.7 million, a 6% increase over the same period in previous year and +36% sequentially (but the first quarter of the year has always a low sales level). Gross profit margin was 79.4%, a slight increase over previous quarter. EBITDA increased to € 7.3 million compared to € 4.7 million in Q2 2013. EBITDA margin increased to 30.9%, from 26% during the same period in previous year. Net income was € 3.9 million compared to € 1.3 million in Q2 2013, although the favourable comparison is due to non-recurring items that weighed on 2013 results.
Q3 2014 update
Revenue for the quarter increased to €24 million, 9.8% higher than same period 2013 and a 13% increase on a sequential basis. The improvement is due to a better product mix and an increment in sales on direct channels (retail and e-commerce). Remarkably, margins improved on a sequential basis: reported gross margin was 81.7%, operating margin 30.7% and net margin 20.4%, although all these values are lower than a year ago. The unfavourable result is mostly due to the increase in services costs that in Q3 2014 had an incidence of -29% of revenue.
Valuation - updated
The stock is currently trading around €1. This implies a trailing P/E of 15. Trailing P/S is 2.3 while P/B is 2.6. Finally, EV/EBITDA is 7.8.
The situation now is interesting both because ratios are currently attractive and because last quarter saw an improvement in margins. Next couple of reports will be important to understand if current margins could be considered the "new normal". The negative side is that the company, reducing leverage, is also reducing the ROE, which is currently around 18.5%, a reduction of 5% from full year 2013 result. That said, I see the ROE decrease as a positive thing, since it reduces financial risk while the business is changing structure. Also, once the industry will be mature and revenue stream predictable, management could easily choose the preferable debt target and corresponding ROE. At current valuation I consider the price attractive for those interested in building a long term position in Moleskine but, for the moment, the stock still seems under selling pressure although there was some buying below 1. I will consider a long entry once more accumulation signs will arise.
DISCLAIMER
References:
Annual Report 2013
Interim Financial Statement Q1 2014
Interim Financial Statement Q2 2014
Interim Financial Statement Q3 2014
