S&P 500
Last update 05/03/2015 - Previous analysis
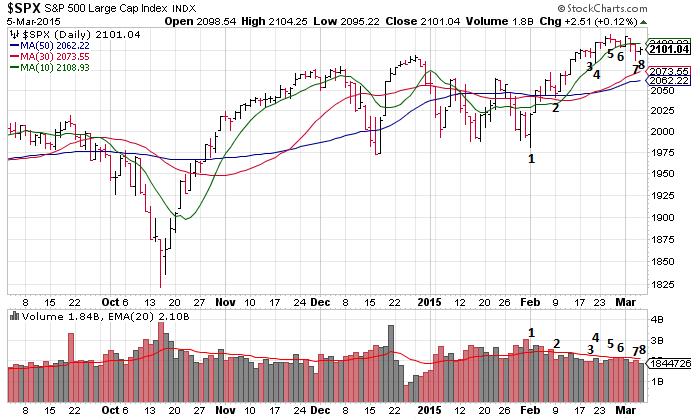
1 - Although the body is wide, this candle represents a rejection on new lows due to lack of sellers (volume is low) and the next candle provides confirmation to this "test"
2 - This is a proper test: narrow body on very low volume and the next candle confirms it
3 - Another confirmed test: long bias still in place
4 - This is an effort to rise, but next candle is down. Not much result from the effort
5 - Narrow bar on new high and increasing volume: buyers are finding sellers up here
6 - Here we find support since the bar is narrow, volume increases and next candle is up
7 - Again, the effort doesn't produce a result and price falls, but the candle closes off the lows. This bar could contain buyers
8 - This is an up bar on very low volume (the lowest since January): if confirmed, this means that there aren't many buyers left and background is bearish
There are signs of weakness: the market could be ready for a retracement, be careful.
FTSE Mib
Last update 16/02/2015 - Previous analysis
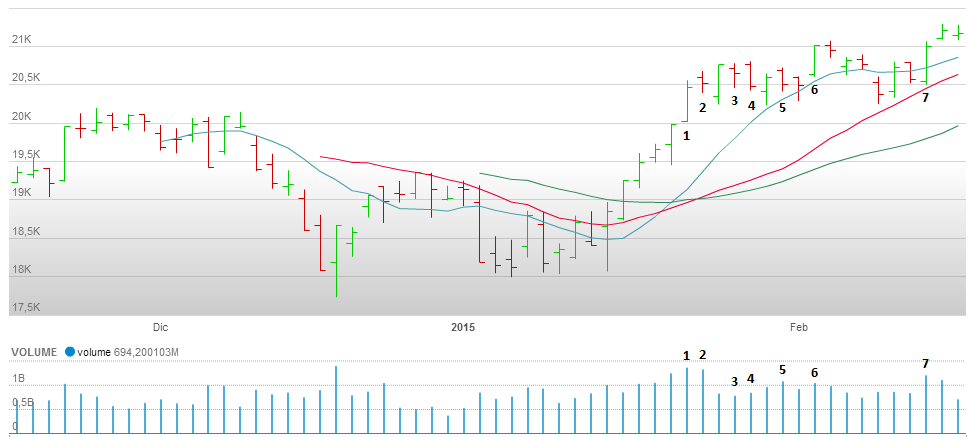
1 - Momentum drives price higher. This candle has long spread and very high volume but closes off its highs. Again, some selling could be hidden in this candle
2 - We have sellers also here. The candle has a high volume (just slightly lower than the previous day) and a narrow spread. It also touched new highs but closed lower
3 - This could be interpreted as a test, but next candle fails to confirm it: sign of weakness
4 - Down bar on increasing volume, although low on an absolute basis: retracement
5 - Down bar on high volume and a narrow spread: here there could be buying that support the price. This is confirmed by the next candle that is a confirmed test of no supply
6 - This candle confirms the test but the next candle its a narrow spread candle on high volume, another distribution sign
7 - Ultra high volume candle with a wide spread. Since we have a series of tops on the left, this could be absorption volume. The next candle is somewhat weak again since it has a narrow spread and a high volume
The market is resting and there is some distribution sign. I'm cautious at the moment since the trend is still up (higher highs and higher lows) but the market didn't run much after touching new highs. I'm also not finding any low risk set up at the moment so I will stay on the sideline.
