FTSE Mib
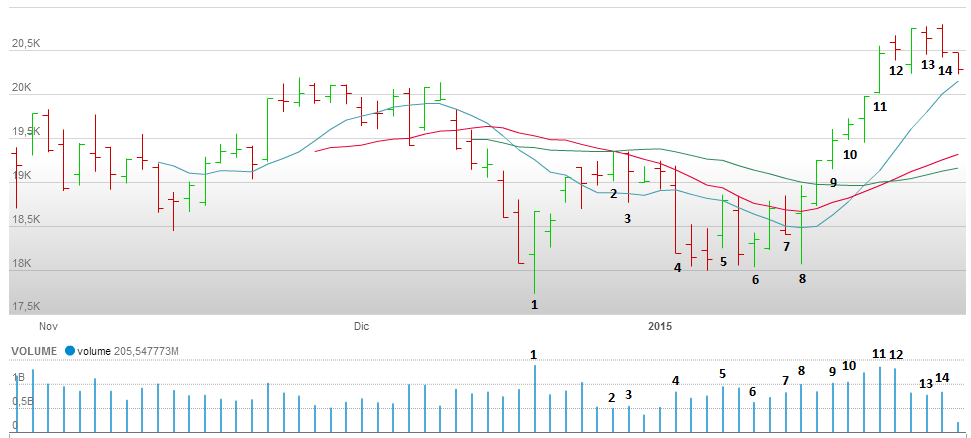
Last update 28/01/2015
1 - Buyers entered on this candle that has a high volume and closes on its high after touching new lows. Also, note that it's in the area of previous support zone (second red candle in the chart)
2 - This candle signals lack of demand up here
3 - This is a confirmation of lack of demand, a lower close on volume, although some buying could be contained here since the candle closes off its lows
4 - Long spread down bar on high volume, this candle seems signalling weakness but the next two candles' close are not much lower: there must be some buying
5 - This candle confirms that there are buyers at this price, but sellers are not exhausted since the next candle is down
6 - This is a test: lower low on low volume and closes in its highs, if next candle closes higher on higher volume we'll have confirmation of lack of supply. Indeed, the next candle confirms market strength
7 - Down bar on higher volume, supply is still present although long bias remains
8 - This candle confirms that having a long bias is correct. We have a strong reaction from lows and the next candle closes higher. To have the final confirmation of the correctness of the long bias a low volume test is needed
9 - This candle is an up candle on high volume that closes off its highs: some selling entered here
10 - Again, we have sellers here. Volume is the highest since candle 1 and spread is narrow. If that volume was buying, why the spread is so narrow? The bias is still long, but we have a sign of weakness. To have a confirmation that buyers are still in charge, market needs a retracement on low volume
11 - Momentum drove price higher. This candle has long spread and very high volume but closes off its highs. Again, some selling could be hidden in this candle
12 - We have sellers also here. The candle has a high volume (just slightly lower than the previous day) and a narrow spread. It also touched new highs but closed lower
13 - This could be interpreted as a test, but next candle fails to confirm it: sign of weakness
14 - Down bar on increasing volume, although low on an absolute basis: retracement
