S&P 500
Last update 30/01/2015
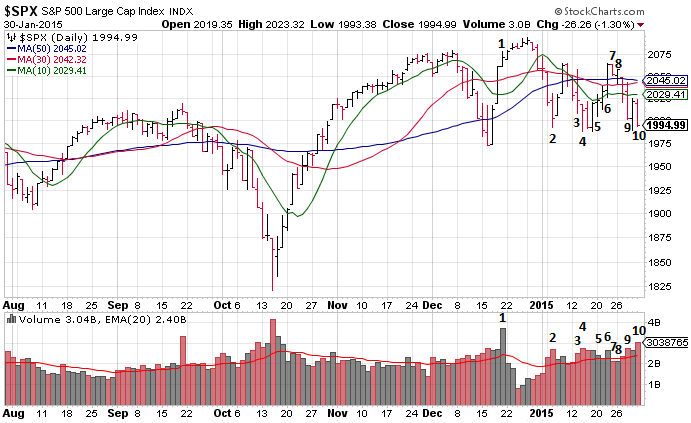
1 - This is a big sign of weakness: a small spread candle on ultra high volume that closes in the middle at the top of a move. This is a distribution candle even if the price moves higher afterwards: the following move has very low volume so there isn't interest in higher prices. The down move is the result of this action
2 - Increasing volume in this down bar that closes off its lows. There must be buying in it. Indeed, the following bar confirms this
3 - Price retraces again but with less interest, this candle is though since it closes in its middle on high volume. This could represent that buyers are now in control
4 - This candle sustains the hypothesis that there has been a change in the supply/demand dynamic of the market since there is a strong rejection of new lows. A rally could start from here although it needs a confirmation today with a close higher. It would also be safer waiting for a low volume test of supply. The rally could also be of short term since distribution could arise again in 2060-2080 area
5 - This is a test: price went lower but didn't find sellers, so it retraced. Volume is low (selling exhausted). We need a confirmation of this since a failed test would imply weakness. Next 1-2 candles should close higher on increasing volume
6 - Test is confirmed on this candle, which closed higher on increasing and a high volume
7 - This candle signals lack of supply. Volume is very low and it confirms my long bias
8 - Failed test. This is a sign of weakness
9 - Increasing volume on a down candle, but next candle is up. There is some buying activity in this candle
10 - Down bar on ultra high volume that closes on its lows. Next candle will tell if there is buying in this candle
