I closed my UCG long on Friday at €5.54 for a gross gain of +3.45%. The main reason is that on Wednesday the company will release the Q4 earnings and I don't want to hold a stock into earnings releases. The stock also showed a sign of weakness and I decided to take profit and avoiding both earnings release and holding the stock during the weekend. This is the detailed technical analysis:
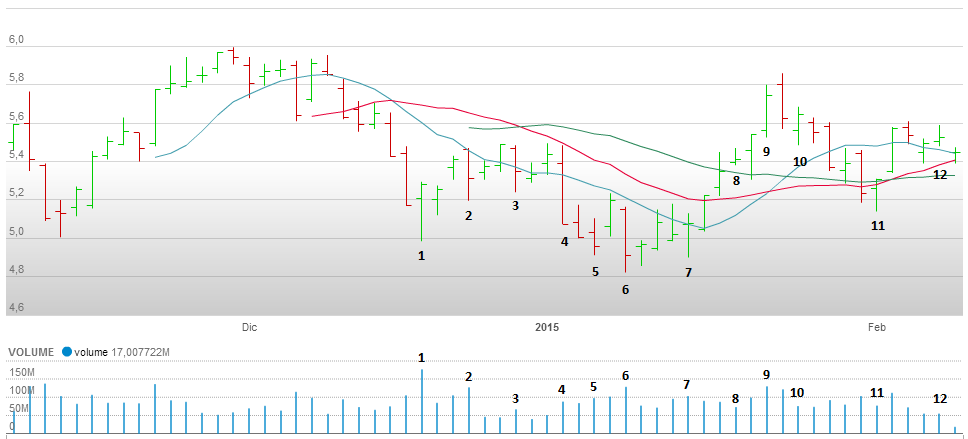
121 - Rejection of new lows: buyers entered here
2 - Down candle on high volume: sellers are still present, although there is support of the move since the closure is off the lows. Next candles signal that there is low interest in higher prices (low volume)
3 - Again, down candle on rising volume closing off its low and again lack of interest in the following rally
4 - Wide spread down bar on rising volume. There is some weakness but volume is not high
5 - here we have higher volume on a down bar with a narrow range and the next candle closes higher on increasing volume: buyers supported price here
6 - Wide spread down bar on high volume that closes off its lows and next candle is up: again, buyers are hidden in this candle, bought on a down day but following rally lacks of volume again. There is still supply out there and buyers don't want to fight it
7 - This is a failed test of supply. It is successful because next candle closes higher, but the volume is high, so there is still supply. Further, the next candle is an up bar on volume lower than two previous candles: there is lack of interest in higher prices
8 - Narrow spread candle, upthrust: this candle signals lack of demand but next candle reacts
9 - Wide spread candle on ultra high volume that closes off its highs. This candle could contain selling. This will be confirmed if next candle closes down
10 - Test of supply but next 2 candles fail to confirm: this is a sign of weakness
11 - The retracement continues and we face another test of supply. The important thing is that it is in the same zone of candle number 1. This is important because it means that we don't have any more people that want to sell at this price, although a confirmation is needed
12 - This is another sign of weakness since we have a test of supply in the previous candle, but candle 12 is a weak confirmation. A low volume candle that closes in its lower range is a sign of weakness (no demand)
 RSS Feed